More concept, ideas and investment strategies with Jitta
# 1 : Portfolio Management
As promised, I have written this article to explain concepts on how to look at our investments in the big picture, in terms of looking at the Portfolio to better understand investment and the origins of Jitta Portfolio and how to use it.
(For those of you who haven’t tried using Jitta Portfolio, you can access it here: www.jitta.com/portfolio)
The example that we will use here is a portfolio made up of Jitta Ranking Top 5 or Jitta Ranking Top 10 companies since 2008 onwards (randomly assigning top 5 or top 10 to each year), and buying and selling stocks once per year according to the Jitta Ranking principles.
The image of the Portfolio is the present portfolio, in which we chose stocks based on the Jitta Ranking Top 10 at the end of 2013, and averaging every stock in equal amounts (10% for each stock) and held them up until November 10, 2014. According to good investment principles, these are the following things we need to study:
1. Looking at the return of the port from YTD (Year To Date)
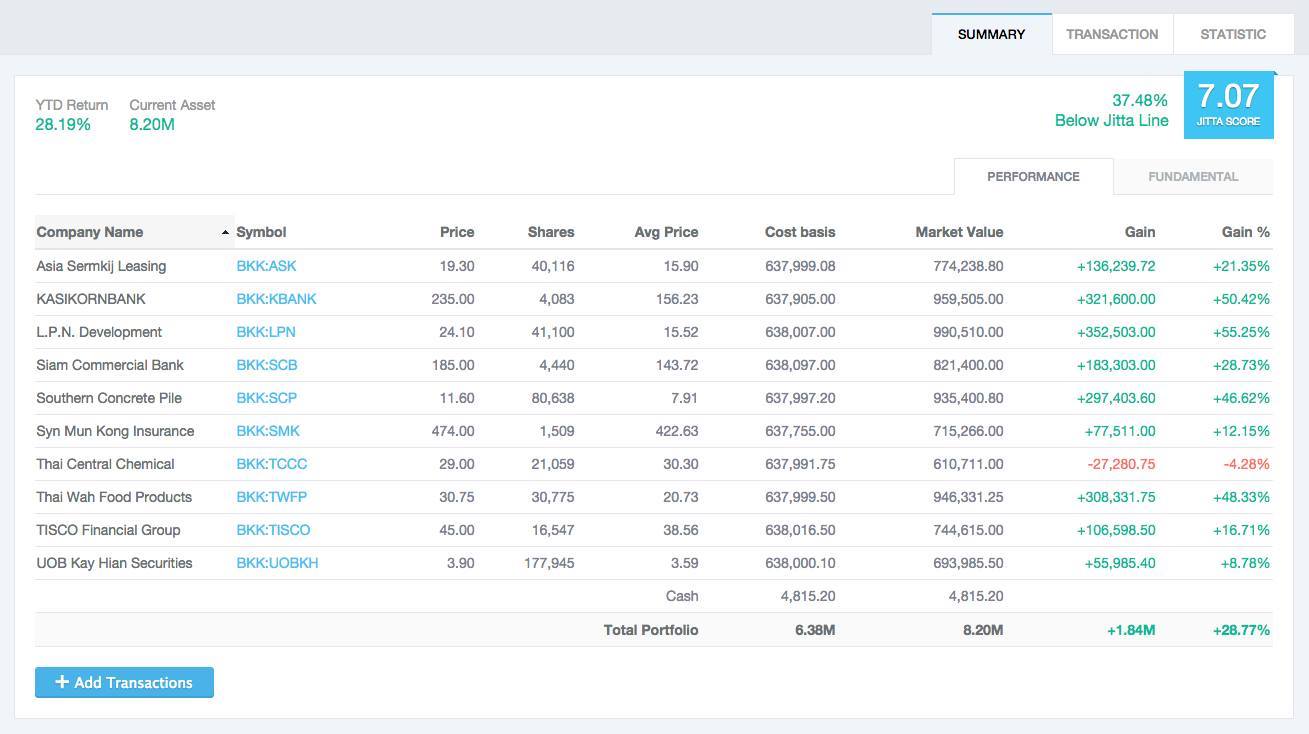
We will see that in the Summary of Jitta Portfolio, underneath the Tab Performance, the look is like a standard port that we generally see, showing us the returns from each stock that we invested in, and overall how much are we gaining or losing (at Gain and Gain %)
From the 10 stocks in the port, there are 6 stocks that are making over 20% profits’ 3 stocks that are profiting less than 20%, and 1 stock that is making a loss at 4.28%.
This information cannot tell us much about our investment performance, because what’s missing is the time frame in which we started investing in each stock. Remember that when we are evaluating our return on investment, we are measuring by year, and we have to compare our return with the return from other investments, such as bank savings, bonds, or the overall market return.
For example, for the stock that generates a 55.42% profit, we have been holding onto it for five years, which means we get a compounded return of 9.22% per year. Or if we had been holding the stock for three years, we would make a compounded return of 15.83% per year (if our goal is at 20% return per year, the we re considerably lower than our target with this investment)
Therefore, the Total Gain value is just an illusion that tricks us into feeling happy that we are profiting. It does not truly reflect our ability in investment, or whether our returns match up to our target or not. If we cannot evaluate in this sense, then we cannot learn from our investment.
To fix this, Jitta’s Portfolio includes the YTD Return at the top left hand corner to allow you to see your return clearly -since the beginning of the year, what is our return (%), in the case of YTD Return of 2014, the return is at 28.19%, compared to the SET 50 index’s 18.98%, showing that we outperform the market at almost 10%, which is pretty good. If our target was at 20% per year, it means that we exceed our target by 10% as well.
To calculate YTD Return you look at the Total Assets at that beginning of the year (starting from the last price on the last day of last year) and the Current Asset (current stock price). This reveals this year’s investment, regardless of how long you have been holding that stock.
Having the YTD Return figure is going to reduce the hassle of investing, because we wouldn’t be too fixated on the fluctuating stock price in each day, or which stocks profit or lose most, etc. None of these things are of a great concern to us because as long as the YTD Return figure still beats our target, we would be satisfied. Once our emotions are stable, we would view a loss as an investment norm and a lesson for us to figure out as to why we had that loss, what did we do wrong; to improve our investment methods in the future.
2. Always set aside cash for investment and include it as part of your portfolio.
For investors, one thing you should do is the separate your personal account from your investment account, so that you are able to calculate your returns accurately.
You will see that from the bottom image of Jitta Portfolio, there will always be a cash figure that is included in the Total Portfolio, because it is considered an asset aside from stocks. When we calculate return, we have to include all of our assets. Let’s say we have a total of $1 million, and we use $300,000 to buy stocks, and overall make a profit of $150,000. We might be happy that our return is 50%, when in reality, looking at the overall return that includes other assets, we only make 15% from stocks. Therefore, including cash into the AUM (Asset Under Management) will produce the most reflective and accurate YTD Return.
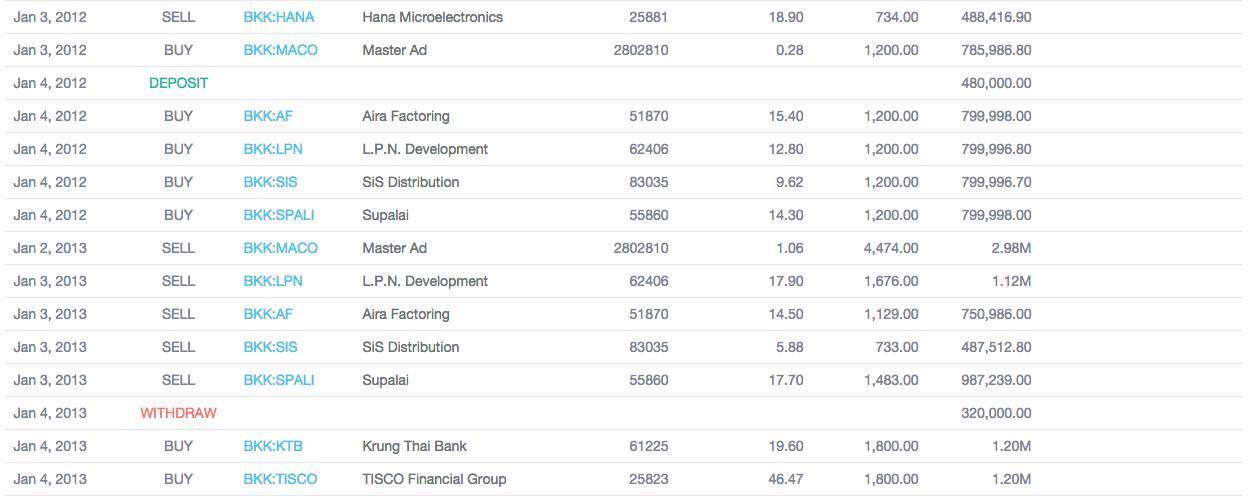
Jitta Portfolio allows you to Deposit/Withdraw cash from the portfolio, so that you are able to calculate your returns accurately. In the Transaction page, we also display the Deposit/Withdraw amounts for you to see how much money you put in or take out, and at which points in time.
Another important thing to take note is, by planning your investment and setting clear Deposits/Withdrawals, it would be easier for us to take out some money from our profits for personal use. For example, if we set the target at 20% per year, and in some year, we make 35%, at the end of that year, we can remove 15% of our profits (the amount that exceeds our target), and we can write it down as a Bonus. With this, we can enjoy investing and have fun trying to beat our own target every year.
3. Examine at the strength of our portfolio like examining a business.
As Warren Buffet suggested, “Something that is reasonable in a business will be reasonable in investing.” So when we make decisions in investing, always approach it using a business perspective.
The reason people make losses from the stock market is because when they sell stocks, they tend to sell good stocks that have high profits, and keep the bad stocks that are making losses. In the end, their money is stuck in these bad stocks whose prices are constantly deceasing (while the good stocks that they already sold are painfully increasing in prices as well).
The reason this happens is because a lot of people only look at the stock price, their initial investment capital, and profit in their portfolio, without further information to assist in analyzing the investments. Therefore, Jitta Portfolio displays information regarding quality and suitable value of the entire portfolio and each individual stock, so that users know when to adjust their port and which stocks to sell.
From the portfolio image, you will see that on the Summary page, there will be a Jitta Score on the top righthand corner (Jitta Score = 7.07 and the overall market value of the port is lower than the suitable value at 37.48% -below the Jitta Line) In calculating the portfolio’s Jitta Score and Jitta Line, we use the approach as though we are the mother company that holds stakes in these many subsidiaries in different proportions. Therefore, we will be able to see the strength of the overall portfolio, and we should adjust is so that the Jitta Score and Jitta Line are in the strong standard value that we want, for example, Jitta Score over 7 and is always 10% below the Jitta Line.
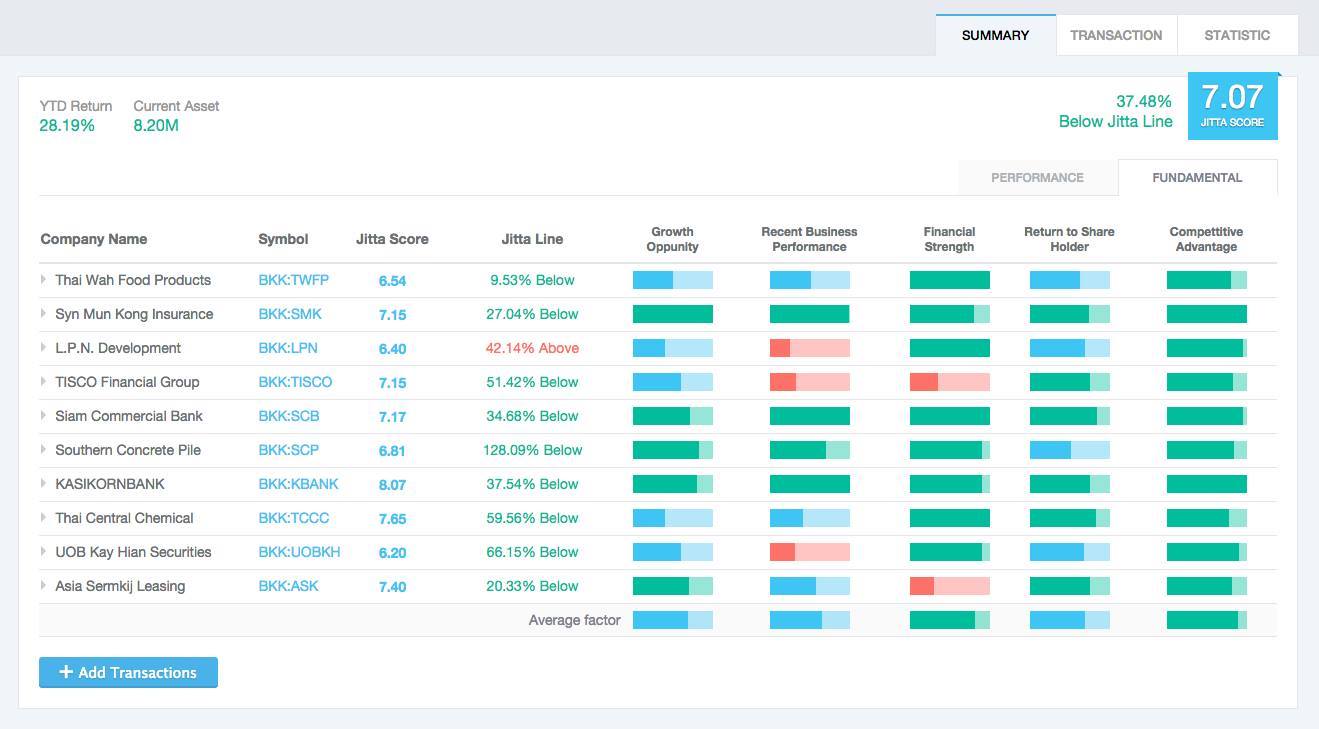
Whenever our portfolio’s Jitta Score is at 6.1 (or the port’s value is 5% Above the Jitta Line), it is a warning sign that we should consider readjusting the port. How will we adjust the port using Jitta Portfolio? Very simple. We have the Tab Fundamental, which displays the quality of each company’s stock (Jitta Score, Jitta Factor) and the high/low price of each stock (Above/Below Jitta Line).
From the example above, if our port has a Jitta Score of 6.1 and is 5% Above Jitta Line, and if we would like to adjust it back to having a Jitta Score of more than 7 and 10% Below the Jitta Line, we just have to sell stocks with low Jitta Scores and with higher prices than the Jitta Line, in addition to buying new stocks that have Jitta Scores above 7 and prices 10% below Jitta Line.
This all sounds very simple. But before Jitta, this is no easy task at all. It takes a lot of imagination, plus a visualization of so many different figures in excel. Aside from this, even though our portfolio has no bad signs, we can simply adjust the individual stocks to improve our port’s strength, because Jitta Portfolio will display the Jitta Score, Jitta Factor, and Jitta Line of specific stocks at 3 points in time: the day we first invested, the past trimester, and the present time.
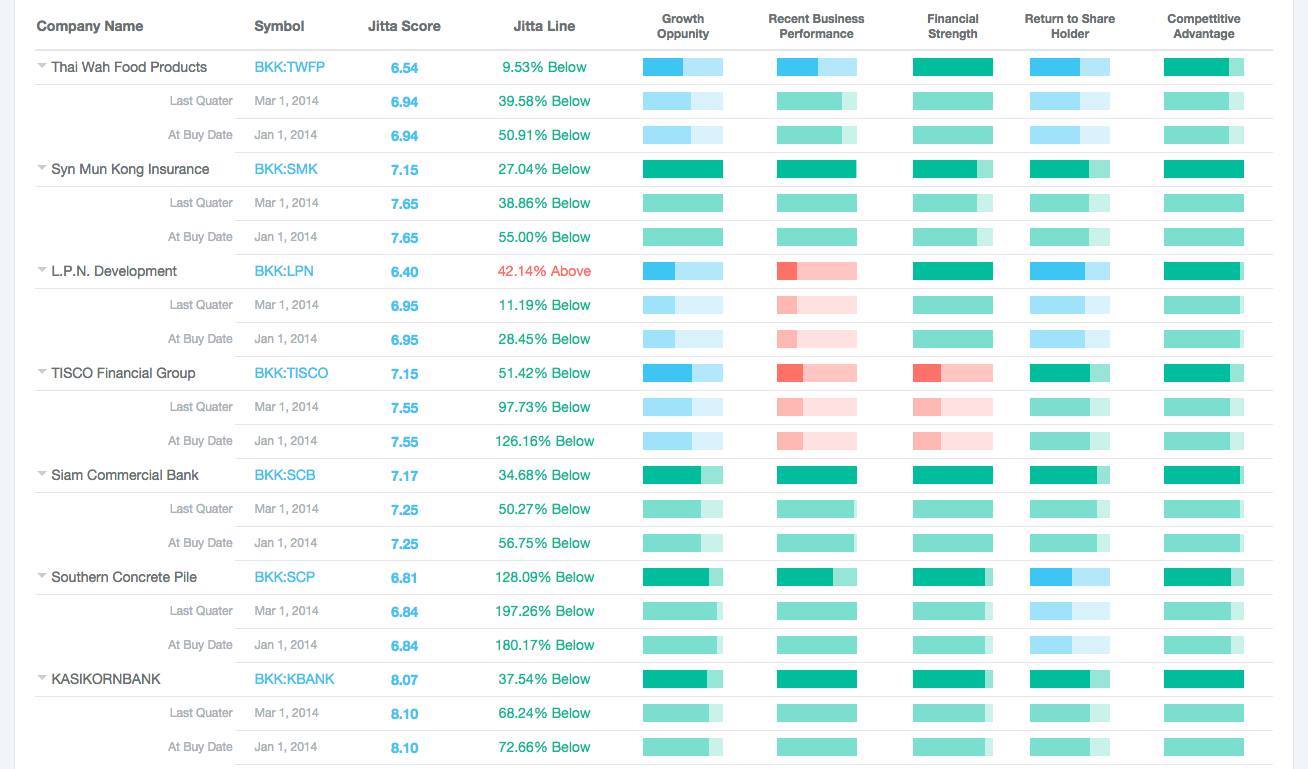
This way, we will be able to spot the stocks whose Jitta Score or Jitta Factor have started declining and whose prices have started to become expensive (which we might decide to sell out). Or if we want the mother company (in this case, our portfolio) to grow and have a competitive edge, we should sell stocks that have low Growth Opportunity and Competitive Advantage, and buy ones that have high-performing values of over 70 instead. Of course, overall your portfolio should be based on the strength of Jitta Score and Jitta line that you want; don’t just keep adjusting when it turns out that the Jitta Score becomes lower than 7. This is obviously not ideal.
With this framework, our portfolio adjustments will become much more logical and systematic, not unlike the creation of a business, and one day, our portfolios will have such strength that rivals that of the great companies around the world.
4. Effectively manage Asset Allocation.
To be continued (this article is getting too long, and I suspect this topic is going to be another long one!)