More concept, ideas and investment strategies with Jitta
Calculating High Low Price in each year using PE
One valuable information on the Jitta FactSheet that is often overlooked is the stock price -more precisely, the highest and lowest price in each year (It is the number in the High Low line, on top of the graph in the Factsheet). This information is useful because once it is being compared with some financial figures of the company, such as EPS, we can roughly evaluate the stock price in the future.
Generally, the stock price is determined by 2 main factors:
- The profit that the company is actually able to produce: EPS
- Investors’ valuation of that stock: PE
Therefore, the equation for Price is very simple:
Price = EPS x PE
So for the stock price to increase, either the company has to make higher profits, or the investors have increasing confidence in the firm.
Now when we look at the fact that the company’s profit is quite a solid figure that everybody can access, a figure that does not change often (at most 4 times a year in quarterly reports; of course, we are not counting all the speculations and rumors driven by the public). This shows that when the stock price fluctuates a lot each day, month, or year, it actually comes from the evaluations and assessments that investors have on that stock or investing in general. Not much to do with the actual profit figure at all.
Suppose in 2013, a company has an EPS of 1 Baht…
- If investors have a lot of faith in the company’s future, the PE will be high, hence the stock price will also rise. For example, if the PE is 15, the stock price will be 15.
- If, however, investors view a bleak future and lose faith in the company, the PE will be low, hence the stock price will drop. For example, if the PE is 5, the stock price will be 5.
Therefore, in the long-run, we can safely invest in a ‘great’ company because regardless of investor expectations and predictions, each year the earnings will still rise anyway, making the highest price even higher, and the lowest price higher as well.
Again, suppose that a company has an EPS of 1 Baht, the profit grows 15% per year, and the lowest PE is 5, highest PE is 15 (every year). Therefore:
- Year 1: the company will have an EPS of 1 Baht. Lowest price 5 Baht and highest price 15.
- Year 5: the company will have an EPS of 2 Baht. Lowest price 10 Baht and highest price 30.
- Year 10: the company will have an EPS of 4 Baht. Lowest price 20 Baht and highest price 60.
When you look at great companies (the ones that have continuously high Jitta Scores) such as ROL, we will see that the trend of the highest price in each year will keep rising, and the trend of the lowest price in each year will keep rising as well.
Which means that if we buy stocks of companies’ such as these at not-too-high prices, the chances of making a loss in the long-run are almost nil. We would only profit (whether a lot or a little depends on the price that we paid for them).
So it follows that if we know the EPS in the future, and know the possible highest and lowest PE, we will be able to predict how high or low the stock price will go in the future. Therefore, we can calculate the risk and return we will get, based on the present stock price.
So where do we find the highest and lowest PE values? Simple. If we know the highest and lowest stock price, and the historical EPS of each year from the Factsheet, we can easily calculate the PE:
- PE (High) = Price (High) / EPS
- PE (Low) = Price (Low) / EPS
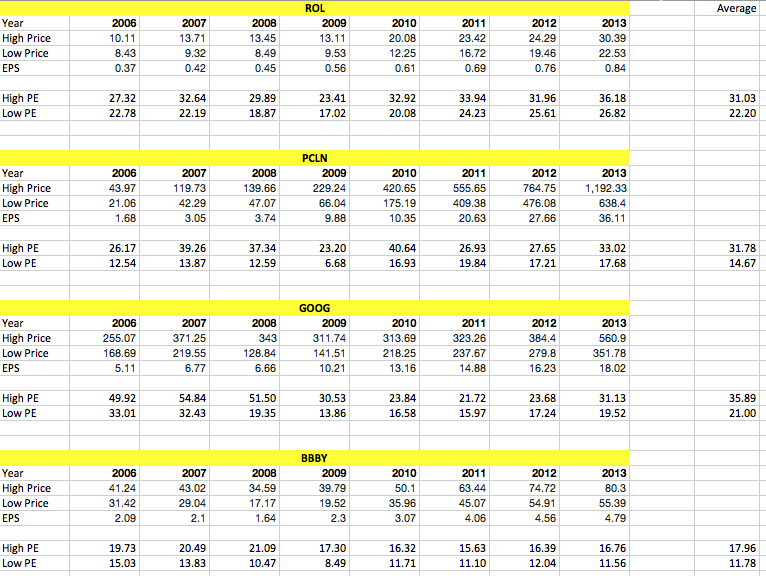
Looking at the example in the image, starting with ROL…
We can see that ROL is a great company with a continuously high Jitta Score, so the price almost never nears the Jitta Line. This is because investors have a lot of faith in this company, causing the price to always be at a premium most of the time.
If we calculate the numbers, we will see that since 2006 onwards, the lowest PE was at 17.02 and the highest was 36.18, which indicates that this is a very strong stock (because even from 2008-2009 during the crisis and market crash, ROL still had a PE of up to 17.02, which is considered quite high). If this company is able to maintain its competitiveness, despite going through an economic crisis in the future, the lowest PE should still be around 17.
As ROL’s EPS in 2013 was 0.84, if we predict that the EPS will grow around 10% (the average growth for the past years), we will be able to calculate the EPS of 2014:
0.84 x 1.1 = 0.92
Therefore, the highest and lowest price in 2014 will possibly be:
- Highest price: 0.92 x 36.18 = $33.28
- Lowest price: 0.92 x 17.02 = $15.65
Presently, ROL’s price is at $29.54, and if everything goes right, we have the chance to make a 12.66% profit from our initial investment. On the other hand, if things go wrong, we could make a loss of up to 47.02% of our initial investment.
With these numbers, it is clear that we should not risk investing at $29.54, because the risk of losing is 4 times higher than the chances of gaining. (One must also get lucky 4 times to make up for being unlucky once)
So at which price should we invest, then? First of all, we must find the average of the highest and lowest price ($33.28 + $15.65) / 2 = $24.46
If we invest at $24.46, and if everything goes right, we will make a 36% profit, however, if we hit bad luck, we will lose 36% of our initial investment as well.
Therefore, the appropriate price we should be investing at in 2014 is $15.65 to $24.46. The lower price we are able to buy (lower than $24.46), the more Margin of Safety we will have and the more profit we make (if conditions are favorable) will be higher than the loss we will suffer (if conditions are bad). If we consider that the chances of getting lucky and unlucky are 50/50, in the long-run we can always make profit.
There is another interesting application of using the High Low PE in the past: sometimes, people might view this is quite an extreme method, because there might be some rare event that drives the PE, for example in 2008 and 2009’s subprime crisis in the United States, causing the PE of most stocks during those 2 years to take a hard fall.
If anybody views it it this way, you may use the average of highest and lowest PE for many years (at least 5 years), such as shown in the case of ROL: the average of high low PE from 2006-2013 is 31.03 and 22.2 respectively.
Looking at it this way, the possible highest and lowest price in 2014 is:
- Highest: 0.92 x 31.03 = $28.54
- Lowest: 0.92 x 22.20 = $20.42
This shows us that ROL’s present price of $29.54 is higher than the highest price we calculated (using the highest PE average). So if we had invested, we have a high chance of making a loss in this scenario.
But with these 2 conditions above, we have calculated for only the year 2014. We can of course, calculate further the price in many future years, because as we’ve seen, if the EPS grows every year, in the end, the highest or lowest price will rise no matter what.
If we decide to hold ROL for 5 years and suppose the profit grows 10% every year, we can manage to calculate the price in 5 years time:
EPS in 5 years: 0.84 x 1.1 x 1.1 x 1.1 x 1.1 x 1.1 = 1.35
The highest and lowest price in 2018 (calculated using the Highest and Lowest PE average):
- Highest price = 1.35 x 31.03 = $41.89
- Lowest price = 1.35 x 22.20 = $29.97
So if we want to invest in ROL for 5 years, buying the stock at $29.54 today, we can conclude that worst case scenario, we will break even, but if luck is on our side, we can make a 42% profit (or 7.23% profit per year). So it is really up to us to decide at what level of return will we be satisfied with. If we want more, then we need to buy ROL at a price less than $29.54.
Let’s look at another example of where the stock price is lower than its suitable price: BBBY. The highest possible price in 2014 (calculated by the highest and lowest PE average):
- Highest price = 4.79 x 17.96 = $86.03
- Lowest price = 4.79 x 11.78 = $56.42
In this case, at the present, the suitable price (Jitta Line) of BBBY is around $79, and when the price gradually decreases, we don’t know where it would stop exactly. Here, we use lowest price at $56.42 to calculate. Presently, the price of BBBY is at $59.61, which shows that it is in the low-risk zone, as the price cannot decrease much further.
Before we end this article, I would like to leave behind a few pointers:
Throughout this article, we have talked about the stock price, however we did not say whether or not it is a suitable price. This is because when using PE in calculating the value of the stock, we must remember that the PE only reflects the assessments and evaluations of the investors; therefore, the stock price calculated using this method is based on our own evaluations and predictions (for both best and worst case scenarios)
Another way we can view this is through the Jitta Line -the suitable price in which in the long run, the price will plot, following the Jitta Line anyway. By using the highest and lowest PE to find the ghiest and lowest price in 1 year is through finding the stock price that fluctuates the most (on both high and low ends) of the Jitta Line.
No matter which method we use to calculate stock price, first we must be sure that the company is a good one that has a high chance of growing its profits in the future.
Because if the company is able to grow profitably, regardless of the price fluctuations, the chances of us gaining profits will still be high if we wait to invest in these firms at not-too-high prices.
Therefore, as I always say, try to choose a company that has good fundamentals before you do all the valuations. And if you invest in a company with a high Jitta Score, keep holding on to that company unless you are sure that you have found a much better stock to invest in.
Personally, I do not give much consideration to the highest PE when making my decision, because that is the price that includes all the hopes and evaluations of other investors, and it is something the is unpredictable (it may not even happen in the future again). We cannot control it, so I am happy to just look at the Jitta Line as the highest price, as the chances of that happening are much higher.
On the other hand, I focus much more on the lowest PE, because it indicates what the price would be like if there is a economic and market crisis, and investors lose all confidence. This will help prepare us for the worst case scenario and keep us grounded. Especially for those who invest on margin. By examining our ports constantly, even though there is a crisis or other incidents, the stock price that fell still will not reach the point where we are forced to sell them is a very important thing we must do.
Calculating future stock price by using the PE has its weaknesses. This is because the past PE cannot always predict the future PE. This depends on the company’s capabilities and competitiveness in the future as well. And whether the investors will have confidence in the firm. All of these factors can alter the future PE.
In addition, the EPS changes every time financial reports are issued. It is like calculating the Jitta Line -every time reports are out, we need to recalculate the High Low price every time, so that our information is updated (suddenly, the “Follow” icon appears attractive to you now, doesn’t it)
Therefore, what I said in #1-3 are very important to this method: before we use it, we have to be sure that the company is a good-quality one, and be aware of the possible highest and lowest price (from the evaluations and predictions of other investors in the stock market), compared to the suitable price that we have calculated ourselves.
Lastly, remember that the possible lowest price is more important than the higest price. Being a pessimist while investing will keep you grounded, and will keep you following the number one rule of Warren Buffet: Do not make a loss.
P.s. I did intend to analyze more than 2-3 companies, but as you can see, the article is getting quite long. You can try analyzing some of the other firms yourself, though, with all our data.
Also, if you do try it out yourselves, be aware of the fiscal year vs calendar year. For example, in BBBY, the closing of the fiscal year is not the same as the celandar year, so we had to take the EPS in Fiscal 2014 to calculate the PE in 2013.