Stock Summary
We've got all the fundamental details about the stocks you're into, already analyzed and summed up to make your life easier. It's super intuitive, and you can learn a ton about the business you might want to invest in. Our guide below will show you how it works. Let's get started!

To view a stock’s fundamental analysis, just tap or click on the stock you’re interested in via the SEARCH BAR, JITTA RANKING or EXPLORE BY COUNTRY. You'll be able to view all sorts of information related to the stock.

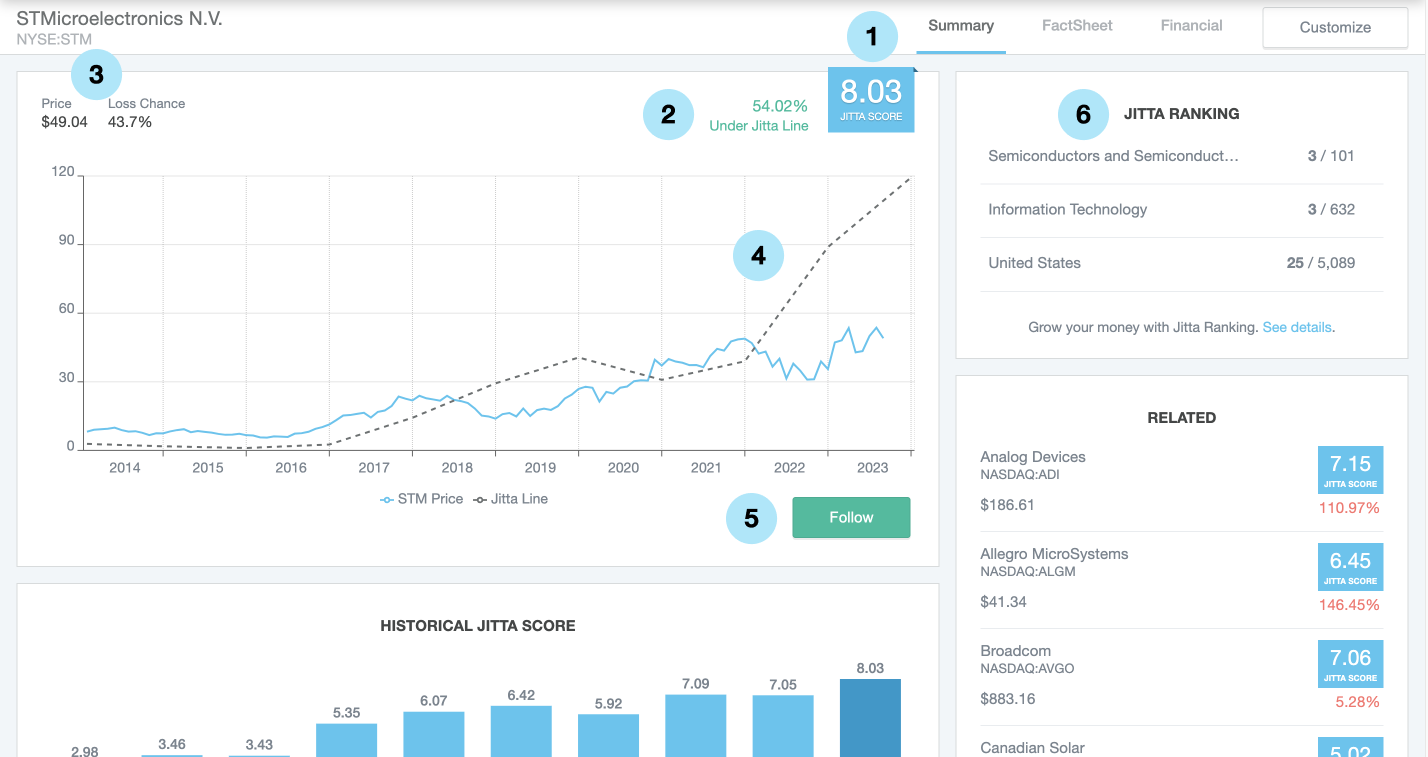
On the STOCK SUMMARY screen, pictured above, you will discover:
- JITTA SCORE tells you how well a company has been performing for the past 10 years. It rates business quality on a scale of 0 to 10, with 10 being off-the-charts amazing.
- BELOW/ABOVE JITTA LINE tells you whether a company’s stock is overpriced or underpriced compared to its fair value.
- Market price (Mobile App) and LOSS CHANCE (Website), the latter is only available on the website and signifies the risk of this stock becoming a failed investment, hence the number should ideally be lower than 40%.
- A graph representing the relationship between market price and Jitta Line, or fair value, in the past 10 years.
- There is a FOLLOW button that you can tap or click to keep up with all the latest updates about the company.
- Jitta Ranking widget can give you the lowdown on where your favorite stock stands against its peers in a country, sector and industry. Jitta Ranking is based on Jitta's own algorithm that takes into account business quality (Jitta Score), fair value (Jitta Line) and growth potential.

You can interact with the screen by sliding left or right on the chart to see how the Jitta Score and stock prices have changed over the past 10 years. Additionally, you can observe the fluctuations between the Jitta Line (dash line) and stock prices (blue line) during each interval of time.

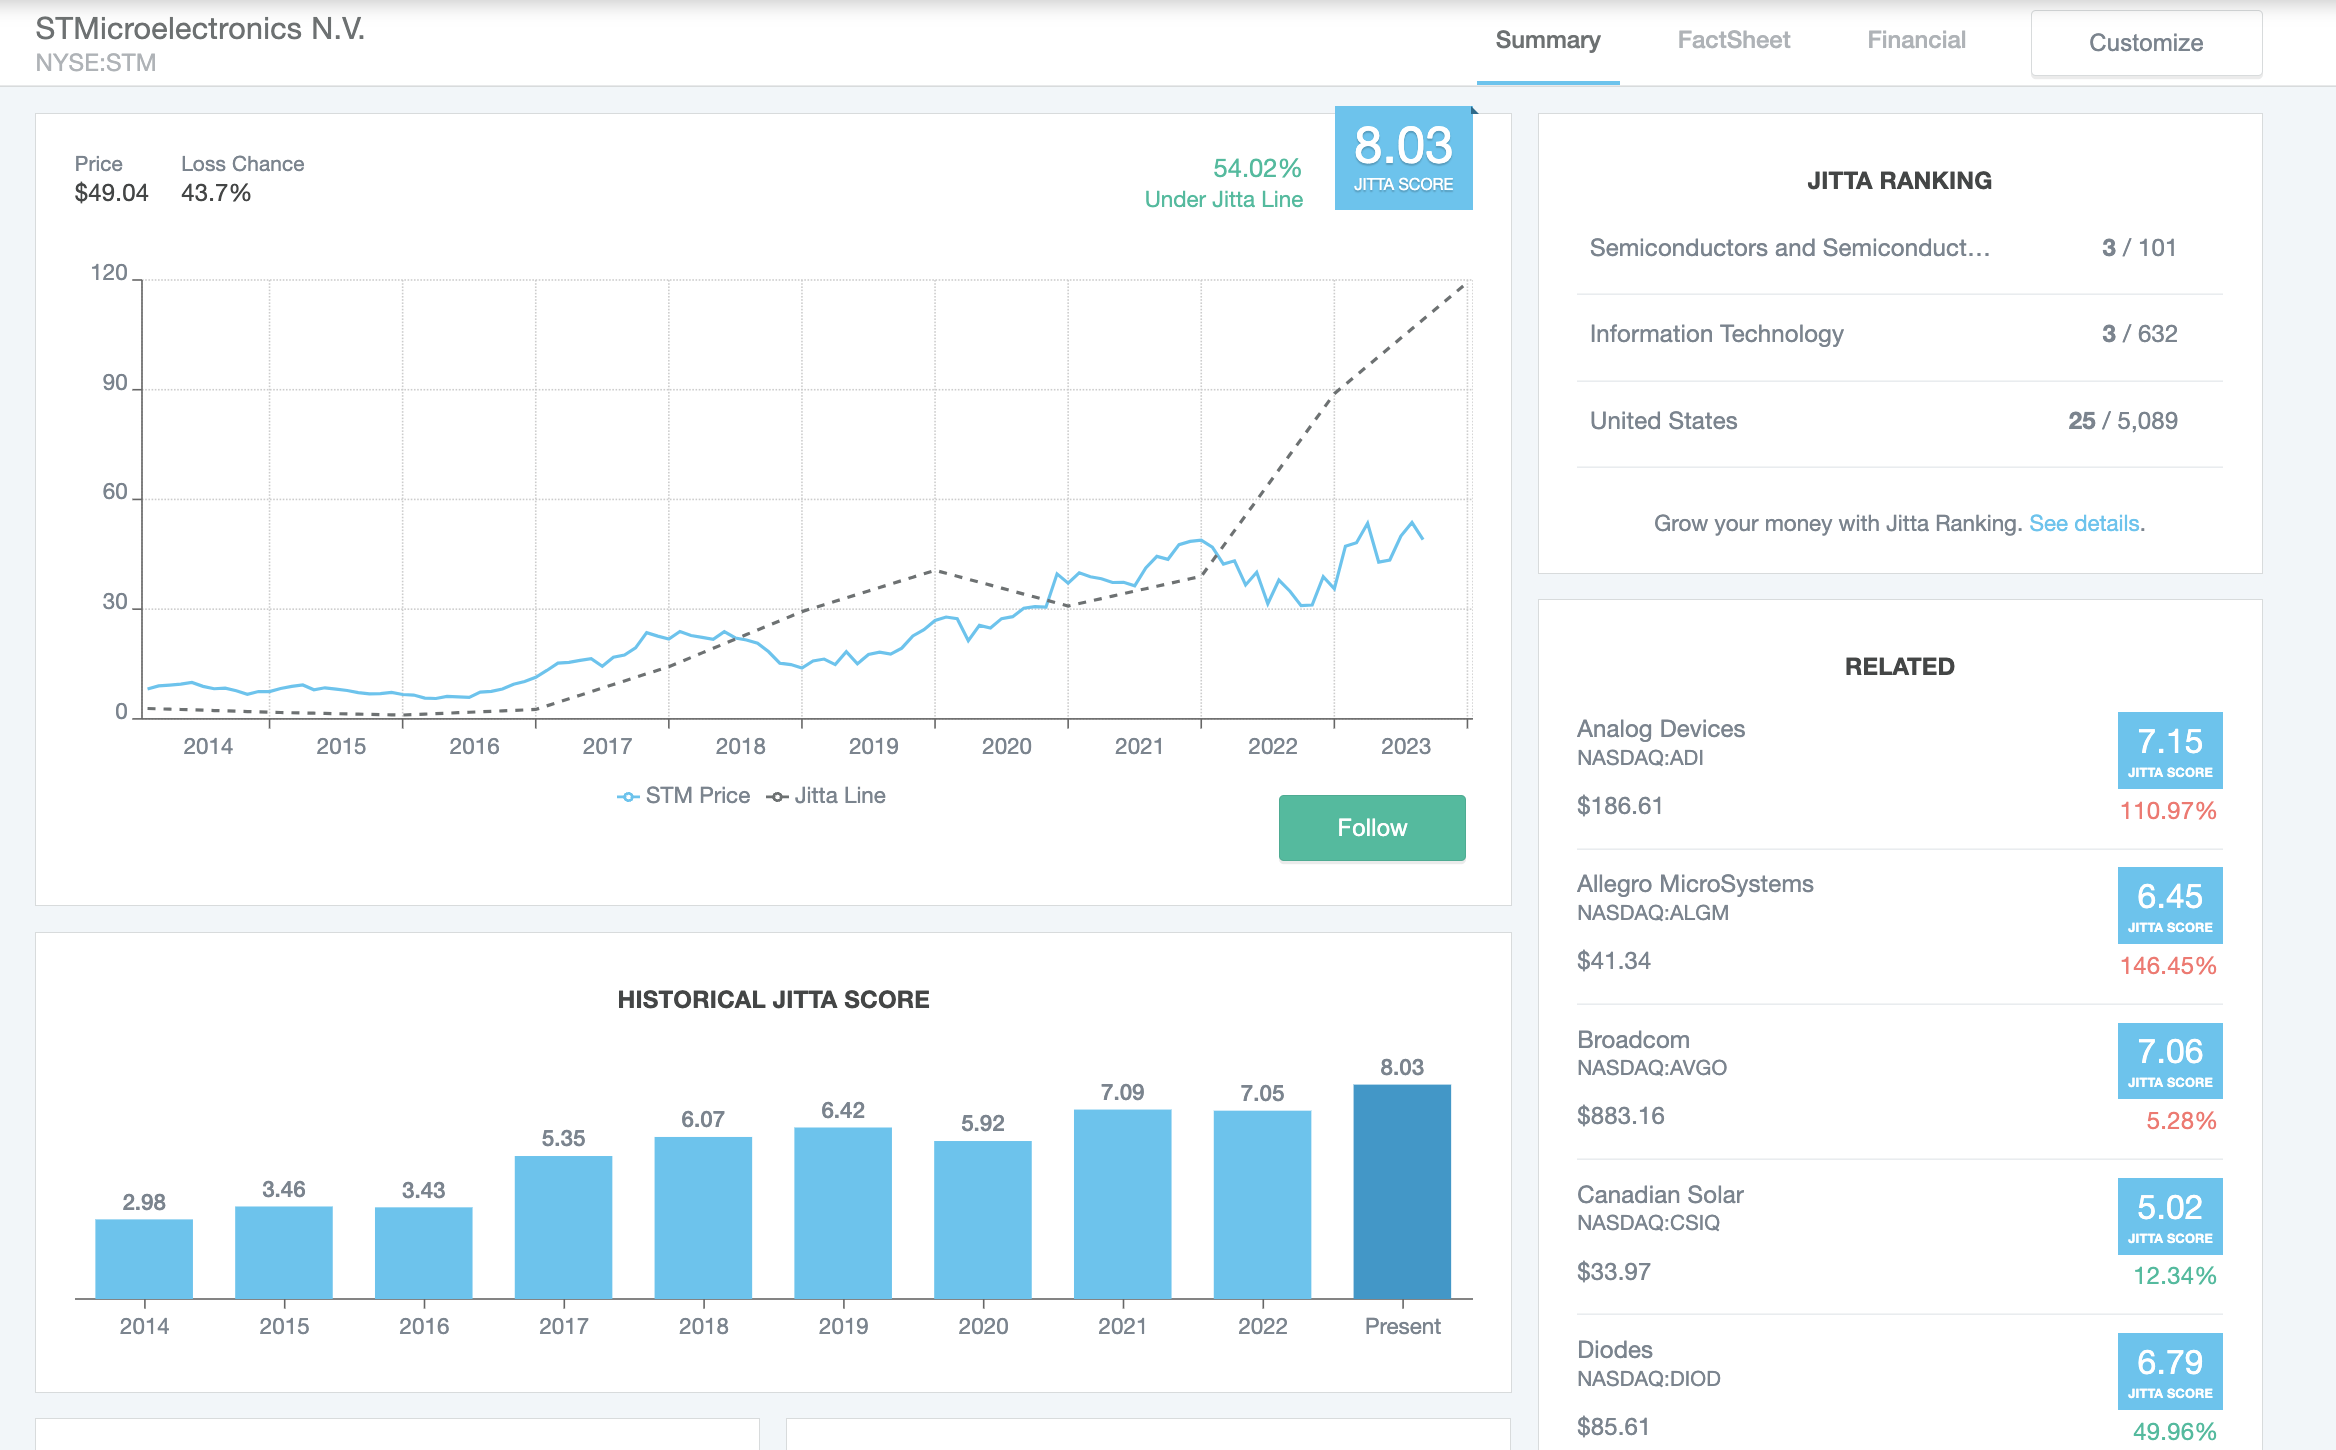
if you're curious about the JITTA SCORE from the last 10 years, just tap on the JITTA SCORE box on the mobile app or scroll down on the website to find the HISTORICAL JITTA SCORE section. There, you'll get a quick overview of past numbers that show how the business has been doing.
If you want to check out more stock information, just keep scrolling down and you'll come across:
- JITTA FACTORS sums up how well a company is doing in 5 key business areas. Each of these areas gets a score from 0 to 100, with the higher numbers meaning better performance.
- JITTA SIGNS reveals the strengths and weaknesses based on its financial statements. If you see green, that's a good sign. But if you see red, that’s not quite a good sign. And if you don't see any, that means there are no clear strengths or weaknesses to speak of.
- COMPANY DESCRIPTION section tells you what this business is all about.

You can also check out JITTA WISE, exclusive to the mobile app, to get a definitive summary of a company, its past performance and investment potential. Simply tap on the book icon at the top right corner.
For more fundamental information, including financial statements and analyst estimates, you can head over to Jitta.com and dig deeper into your stocks of interest.